Report international scams at econsumer.gov
WHAT IS ECONSUMER.GOV?
 econsumer.gov is where you can report international scams and learn about other steps you can take to combat fraud. Your complaints help consumer protection agencies around the world spot trends and work together to prevent international scams.
-
A Survey of Consumer Harm in Cross-Border Transactions from the Korea Consumer Agency

-

-
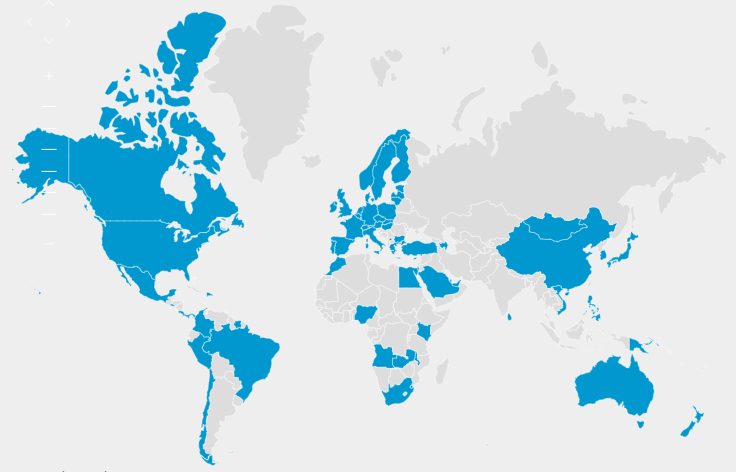
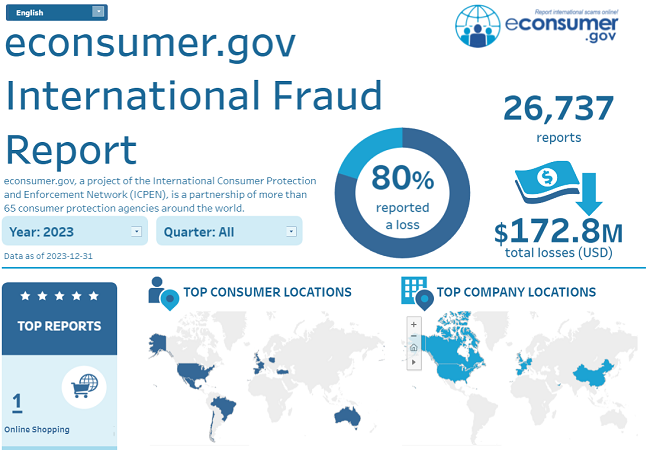
Explore the latest complaint trend data received through econsumer.gov at this interactive dashboard.
-
Latest News
United States of America - FTC announces Impersonation Rule goes into effect April 1 2024
4/3/2024As the Federal Trade Commission’s new rule on government and business impersonation goes into effect today, the agency is …
United Kingdom - Greenwashing investigation: three fashion brands sign formal undertakings
4/2/202427 March 2024: ASOS, Boohoo and George at Asda have signed formal agreements to use only accurate and clear green claims. The undertakings secured by the CMA commit ASOS, Boohoo and George at Asda to change the way they display, describe, and…
Today, the European Commission and national consumer protection authorities of 22 Member States, Norway and Iceland released the results of a screening (“sweep”) of social media posts from influencers. The sweep found that nearly all (97%) of…
United States of America - FTC to host virtual summit on Artificial Intelligence
1/11/2024The Federal Trade Commission’s Office of Technology is hosting a virtual tech summit on January 25, 2024 that will bring together a diverse group of stakeholders to discuss key developments in the rapidly evolving field of artificial intelligence…
-